The Stanley Cup Finals are set to begin tonight with the number seven-seeded Philadelphia Flyers visiting the second-seeded Chicago Blackhawks in what should prove to be an immensely physical and entertaining series.
Both teams are incredible deep and offensively talented. Chicago’s strength comes from their roster depth, their speed and their mobility from the blue line forward. Philadelphia also has strong depth but plays a more physical, brash style of hockey that the Blackhawks will need to contend with and outplay if they intend to win the Cup. The story of this series could be those unlikely heroes who rise to the occasion and lead their team to victory – much like Maxim Talbot did for the Pittsburgh Penguins last year in Game 7 of the Stanley Cup Finals. While the numbers don’t always represent the whole truth, I wanted to see how each team matches up side by side, so I decided to research the stats of some of the key players on each side to see how they compare.
Mike Richards and Jonathan Toews
Richards:
- 21 Points
- 6 Goals
- 15 Assists
- +6
Toews:
- 26 Points
- 7 Goals
- 19 Assists
- +4
Chicago captain Jonathan Toews has beein linked to the Conn Smythe Trophy since as early as the second round with his intense performances every game. But for as good as Toews has been, Richards has been right there working hard to ensure victory for his own team. But as you can see, Toews outscores Richards in every offensive category, and Toews has played one less game overall than Richards as well. The question here is whether Toews can outplay Richards in this series or if the two will eventually cancel each other out.
Jeff Carter and Patrick Kane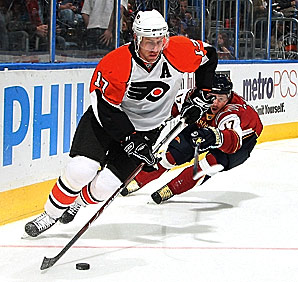
Carter:
- 5 Points
- 4 Goals
- 1 Assist
- +1
Kane:
- 20 Points
- 7 Goals
- 13 Assists
- +2
While Kane significantly outscores Carter in every category, bear in mind that Carter has only played in six games to Kane’s 16. So in roughly a third of the games, Carter has only three less goals than Kane – including two in two games played against the Montreal Canadiens compared to zero goals posted by Kane in the last round against San Jose. It will be interesting to see how much of a factor Carter’s goal scoring capabilities become in this series – especially if Kane keeps dropping beach balls on the score sheet in the goals category.
Claude Giroux and Patrick Sharp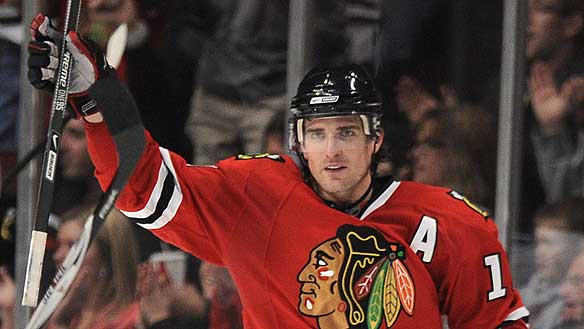
Giroux:
- 17 Points
- 8 Goals
- 9 Assists
- +10
Sharp:
- 16 Points
- 7 Goals
- 9 Assists
- +3
Both of these players have had incredible postseasons, but are relatively unknown outside of their respective cities. Still, as their numbers show, they have been incredible assets to their respective clubs. Giroux slightly edges Sharp in most categories, but the glaring difference between the two is in their plus/minus stats. Seemingly, Giroux is a better all-around player with the ability to backcheck effectively and keep the puck out of his own net while scoring at the other end. Again, the numbers don’t tell the whole story, but if these two get matched up in the series, Giroux could prove to be a difference maker in the series.
Daniel Briere and Marian Hossa
Briere:
- 18 Points
- 9 Goals
- 9 Assists
- +4
Hossa:
- 11 Points
- 2 Goals
- 9 Assists
- +8
The story here is Hossa’s two goals in 16 games, especially after the star forward posted nearly a goal every other game during the regular season. With the amount of talent surrounding him in Chicago, it’s hard to fathom why Hossa only put the puck in the net twice. But his plus-8 is a testament to his work ethic and his ability to back check. Still, Briere outscores Hossa in each of the offensive categories and only lacks in plus-minus. As Hossa makes a bid to get his name on the Stanley Cup for the third time in three years, it will be interesting to see if his lacking playoff performance is an indication to how this story will end. He very well could be the X-factor in this series.
Philadelphia’s Secondary Scoring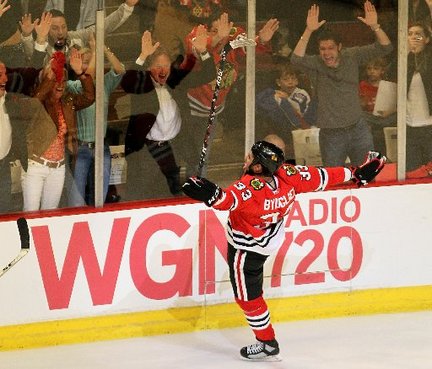
Gagne, Leino and Hartnell:
- 30 Points
- 14 Goals
- 16 Assists
- +10
Chicago’s Secondary Scoring
Byfuglien, Bolland and Versteeg:
- 29 Points
- 17 Goals
- 12 Assists
- +1
These are the depth players who could help make-or-break this series. Byfuglien was a hero for his performances against the San Jose Sharks in the Western Conference Finals, but both teams are very close in terms of offensive production. The interesting stat here is the plus/minus of each respective group. Granted, these players aren’t playing together night in and night out, but there is still heavy differential between the two groups of “secondary” scorers. Offense gets the glory but defense wins the game. Will that be the story of this years Stanley Cup Finals?
Michael Leighton and Antti Niemi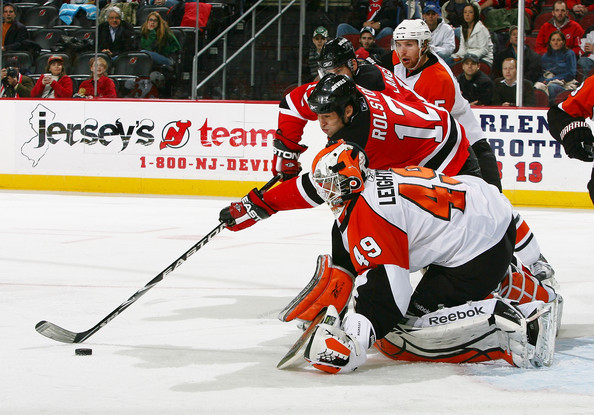
Leighton:
- 1.45 Goals Against Average
- .948 Save %
- 3 Shutouts
Niemi:
- 2.33 Goals Against Average
- .921 Save %
- 2 Shutouts
Is anyone else asking themselves where these guys came from? Because neither goalie was the starting goaltender for their respective club at the beginning of the season, yet both have had superb playoff runs and both are capable of leading their team to victory. In stat comparisons, Leighton wins by a landslide. His 1.45 goals against average is incredible, but Niemi has been more than capable in net for Chicago. This series very well could come down to a dual between Niemi and Leighton between the pipes.
Again, for the tenth time or so, the numbers don’t paint the entire picture. There are plenty of variables in this series that could turn the tides either way. Philadelphia plays a very rough, very physical blue-collar style of hockey. Chicago plays a very speedy game with a lot of mobility and puck-possession. But with two very deep squads who are capable of getting offense from all four of their effective lines, it might come down to who wants it more and who works the hardest to get it. With how similar these teams look on the stat sheet, I’m hoping for nothing less than an a thoroughly entertaining series.


